Collaborative Planning Support System
Summary
We have designed and evaluated a collaborative urban planning support system for an interactive multi-touch tabletop display. The system facilitates the design of spatial patterns of proposed development in a co-located collaborative manner. We worked closely with faculty in the School of Architecture and Landscape Architecture at the University of British Columbia and employed an iterative, user-centered development process to create a tabletop system to support landscape architect's primary urban planning steps. The prototype system is designed for use by urban planners, stakeholders, or private citizens: users with a variety of backgrounds and expertise.
The collaborative urban planning support system was designed for use on a multi-touch tabletop following lessons learned about considerations for planning support systems, tabletop applications, and encouraging collaboration. The system contains a limited yet adequate set of functions for arranging various building types on a development site map. It has an intuitive and highly interactive interface and uses input data that comes directly from the elementsLAB team.
A primary focus of the pattern creation application is ensuring equity of collaboration among users. Urban planners believe that it is important that all members of a group contribute equally to produce a neighbourhood that meets predefined quantitative and qualitative targets. We conducted a controlled experiment that investigated how varying the number of simultaneous touch inputs in the application affects collaboration and output quality. We tested hypotheses that users would (i) collaborate more, (ii) produce higher quality output, and (iii) complete their task faster with a multi-touch application than with a single-touch application. We also tested the hypothesis that (iv) multi-touch interactions with application elements will be preferred over traditional single-touch interactions.
The number of touches accepted did not affect the amount of collaboration, output quality, or time. However, participants perceived the multi-touch tasks to be faster and to produce neighbourhood patterns of higher quality. Participants seemed to be more cognitively absorbed in the multi-touch tasks and they significantly preferred the multi-touch application over the single-touch application. In addition, all multi-touch interactions were significantly preferred over single-touch interactions.
Project Details
Collaboration
I designed, developed, and evaluated the system with the support and guidance of my supervisors (Dr. Booth and Dr. Mackworth) and our colleagues in SALA (Ron Kellett and Cynthia Girling).
Hardware
We used a SMART Table for our prototype, a proprietary multi-touch table created by SMART Technologies. The table is 91.5 cm x 74 cm x 65.4 cm (length x width x height) and the screen is 57.2cm x 42.9cm with a 1024 x 768 resolution.
Software
The application was developed with an object-oriented approach entirely in C# using the SMART Table SDK. The user display consists of a main central map area for neighbourhood designs and three surrounding working areas: the building menu (A), the overview and saved pattern area (B), and the data chart area (C).
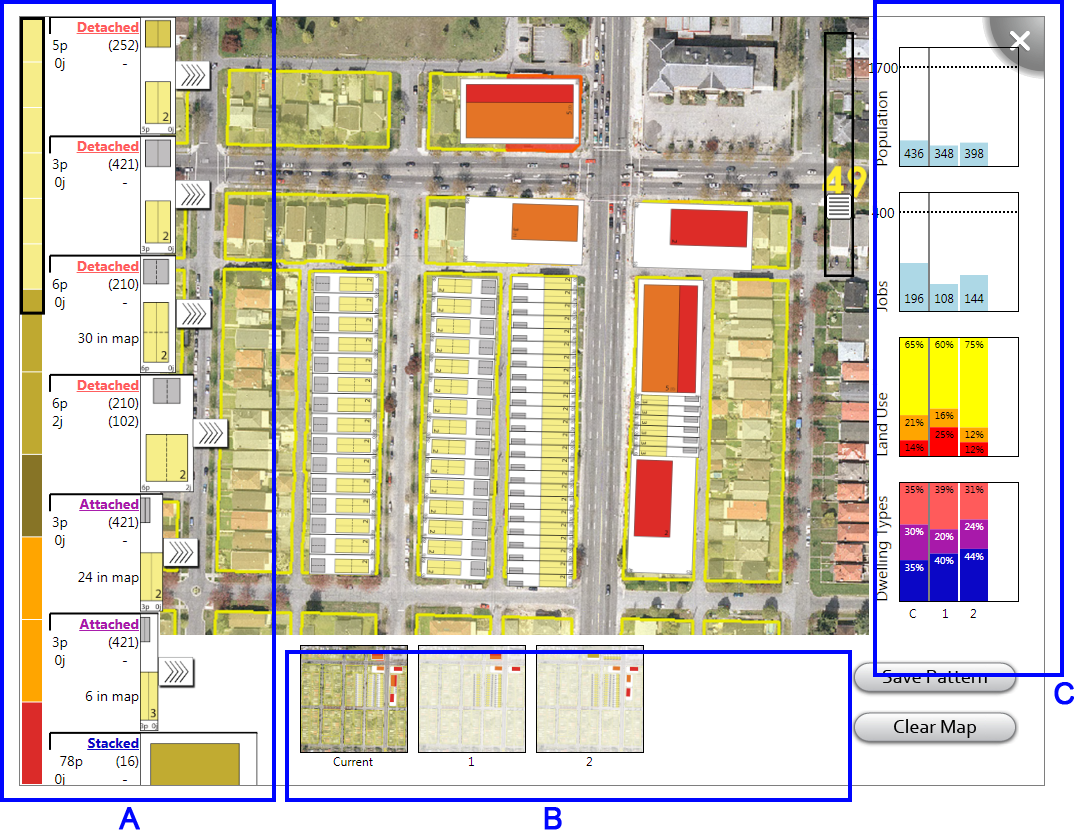
Building Menu
The building menu is designed to aid users in their selection of buildings to arrange in the map, both by presenting all buildings in a meaningful way and by providing affordances. Such affordances help users identify building type diversity and which building types may or may not be good candidates for selection. There are 12 building types to choose from, including 9 residential, 2 mixed use, and 1 commercial.
There are two parts to the building menu: the scroll bar and building details. The scroll bar is used to navigate through the building details. It consists of 12 solid coloured rectangles, where each rectangle represents a building and its colour represents the land use type and density. Residential buildings are yellow, mixed use orange, and commercial buildings are red. We defined colours to differentiate the three dwelling types: stacked, attached, and detached (blue, purple, and pink, respectively). Stacked buildings have four or more stories while attached and detached buildings are single-family residential homes.
Map Area
The map is located in the center of the screen. It can be panned and zoomed with one or more fingers. To zoom with two fingers, the standard pinch-zoom method is implemented. To zoom with a single finger, a user can use the scroll button in the corner of the display.
Charts
Four informational charts are displayed: Population, Jobs, Land Use diversity, and Dwelling Type distribution. The population and jobs charts track how many people live and work in the area, based on the buildings that have been placed in the map area so far. The land use diversity charts shows the ratio of residential, mixed use, and commercial buildings. The dwelling type distribution chart shows the ratio of detached, attached, and stacked buildings. These charts are automatically updated as buildings are dragged into the map area.
Saved Patterns
An small overview of the current map area is displayed along an edge of the screen. Saved neighbourhood patterns are also displayed in this area. At any time in the design process, a pattern can be saved by touching the Save Pattern button. The chart information for the pattern will also be saved in a column in the chart area. A pattern can be restored by dragging its image to the map or deleted by dragging the image over the chart area.
For more detailed information about the system or the user study conducted, please read the paper.