Voronoi Art
Overview
For my final project in the CPSC 516 grad course, I developed a relatively simple technique in Matlab for generating a Voronoi diagram from any image. The algorithm works by importing an image, generating a point sample based on a set of parameters, and then using built-in functions to create a Voronoi diagram based on the sampled points.
Algorithm
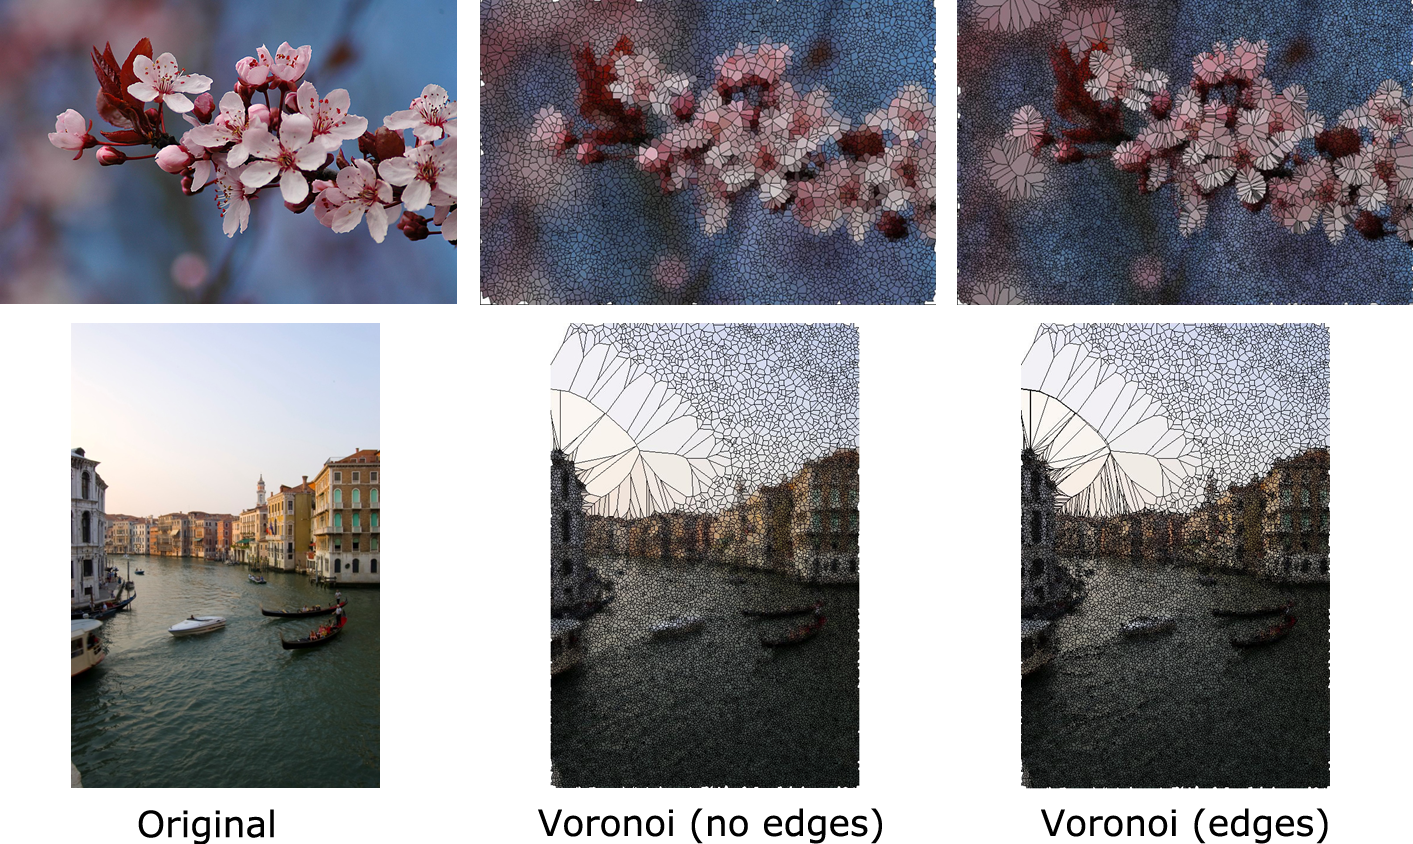
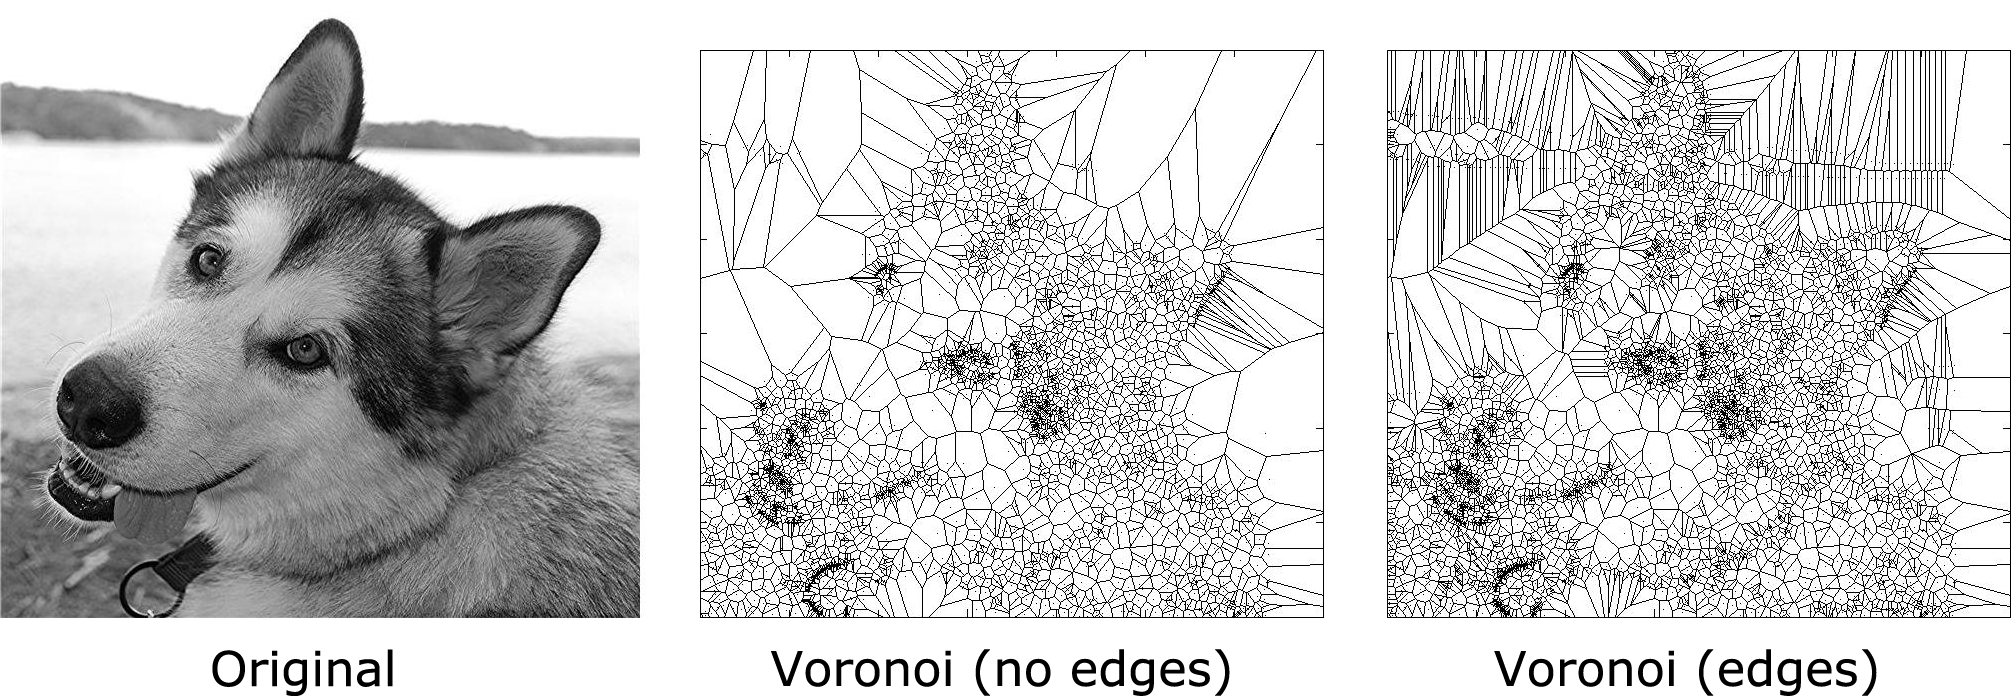
The basis of the technique is that darker regions should consist of more points than lighter regions, so more points are sampled in darker areas on an image. To help improve the output, an optional parameter will run a Canny edge detection on the image to obtain the edges of the image, which can also be point sampled. These two outputs (the original point sampling and the point sampling of the edge image) are unioned, and then a Voronoi diagram is created from all of the points. Sometimes including the Canny edge points improves the output, sometimes it makes no noticeable difference.
To handle colour images, I first generate the Voronoi diagram. I then select a colour for each Voronoi region. My first attempt at colour selection was to pick the colour at the Voronoi site; however, this was not always the best colour representation for the region. Instead, I find the minimum bounding box for each region (to speed up computation) and select the average colour in the bounding box.
Examples